Communities Count Dashboard Tour

Learn how to navigate and download data from our dashboards on our indicator pages! See the step-by-step instructions below, or watch the video tutorial.
getting started
Our website primarily features data presented by interactive dashboards with maps and charts. Users can click on maps and charts to select specific regions or demographics on the bar charts. Hovering over the bars in these bar charts provides additional information, including references to the King County average. These charts also feature box filters on the side that enable data filtering which allows for group comparison.
Video Tutorial
Since the creation of the above video, select dashboards have been updated to feature more visible tabs potentially making some dashboards look different. However, the instructions given in the video still apply and will work the same. Check out the screenshots below to see the new look.
Click to expand the steps below to learn more about how to explore a visualization:
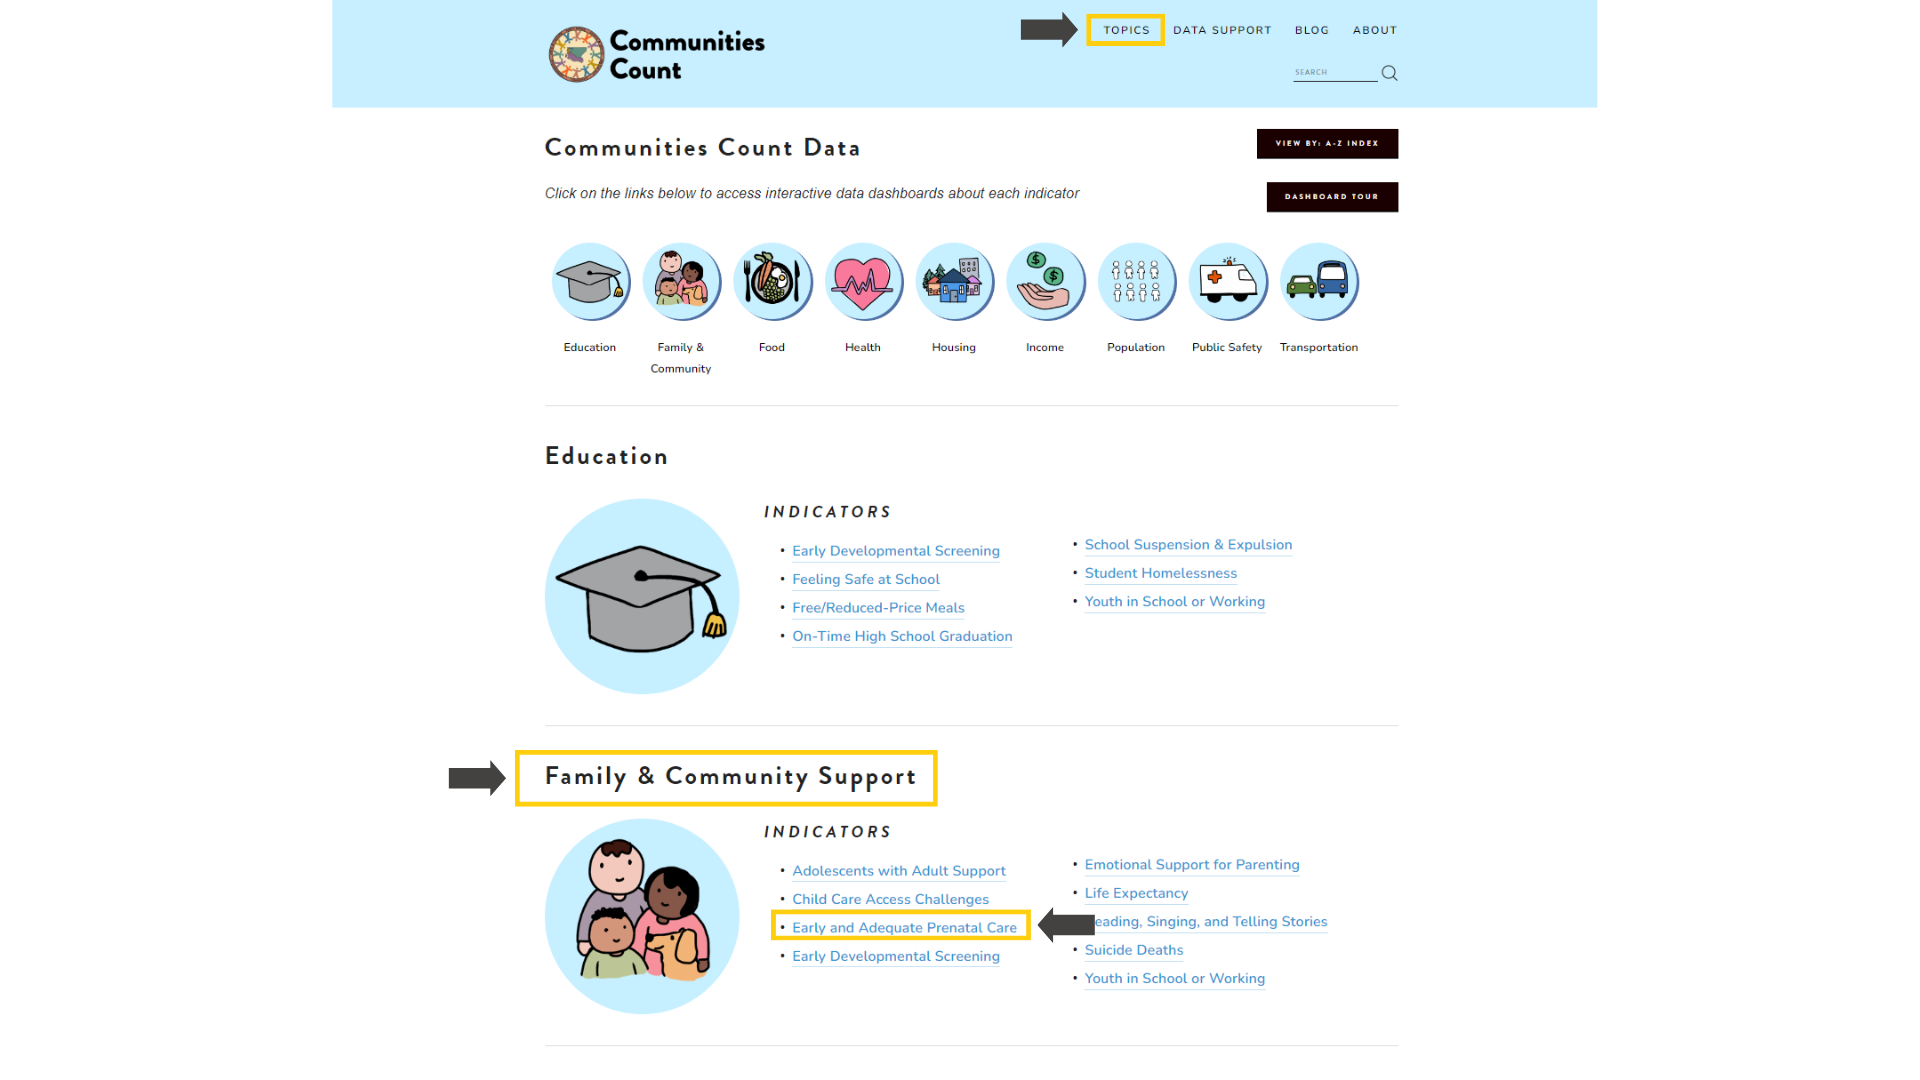
To begin exploring a Communities Count visualization, choose an indicator from the “All Topics” page. For demonstration purposes, we will click on the “Early and Adequate Prenatal Care” indicator found under the “Family & Community Support” tab at the top of the website page.
Clicking on an indicator opens a dashboard of information with clickable tabs on the top, for example: Summary, Demographics, Detailed Demographics, Trends Over Time, Cities and neighborhoods, Notes and Sources and more. The summary tab is sometimes the first page we see as we click on an indicator and contains some general information about Early and Adequate Prenatal Care in King County by region. The summary page also includes maps that display data when hovering over them. This feature is called a tooltip which helps provide more information about an area.

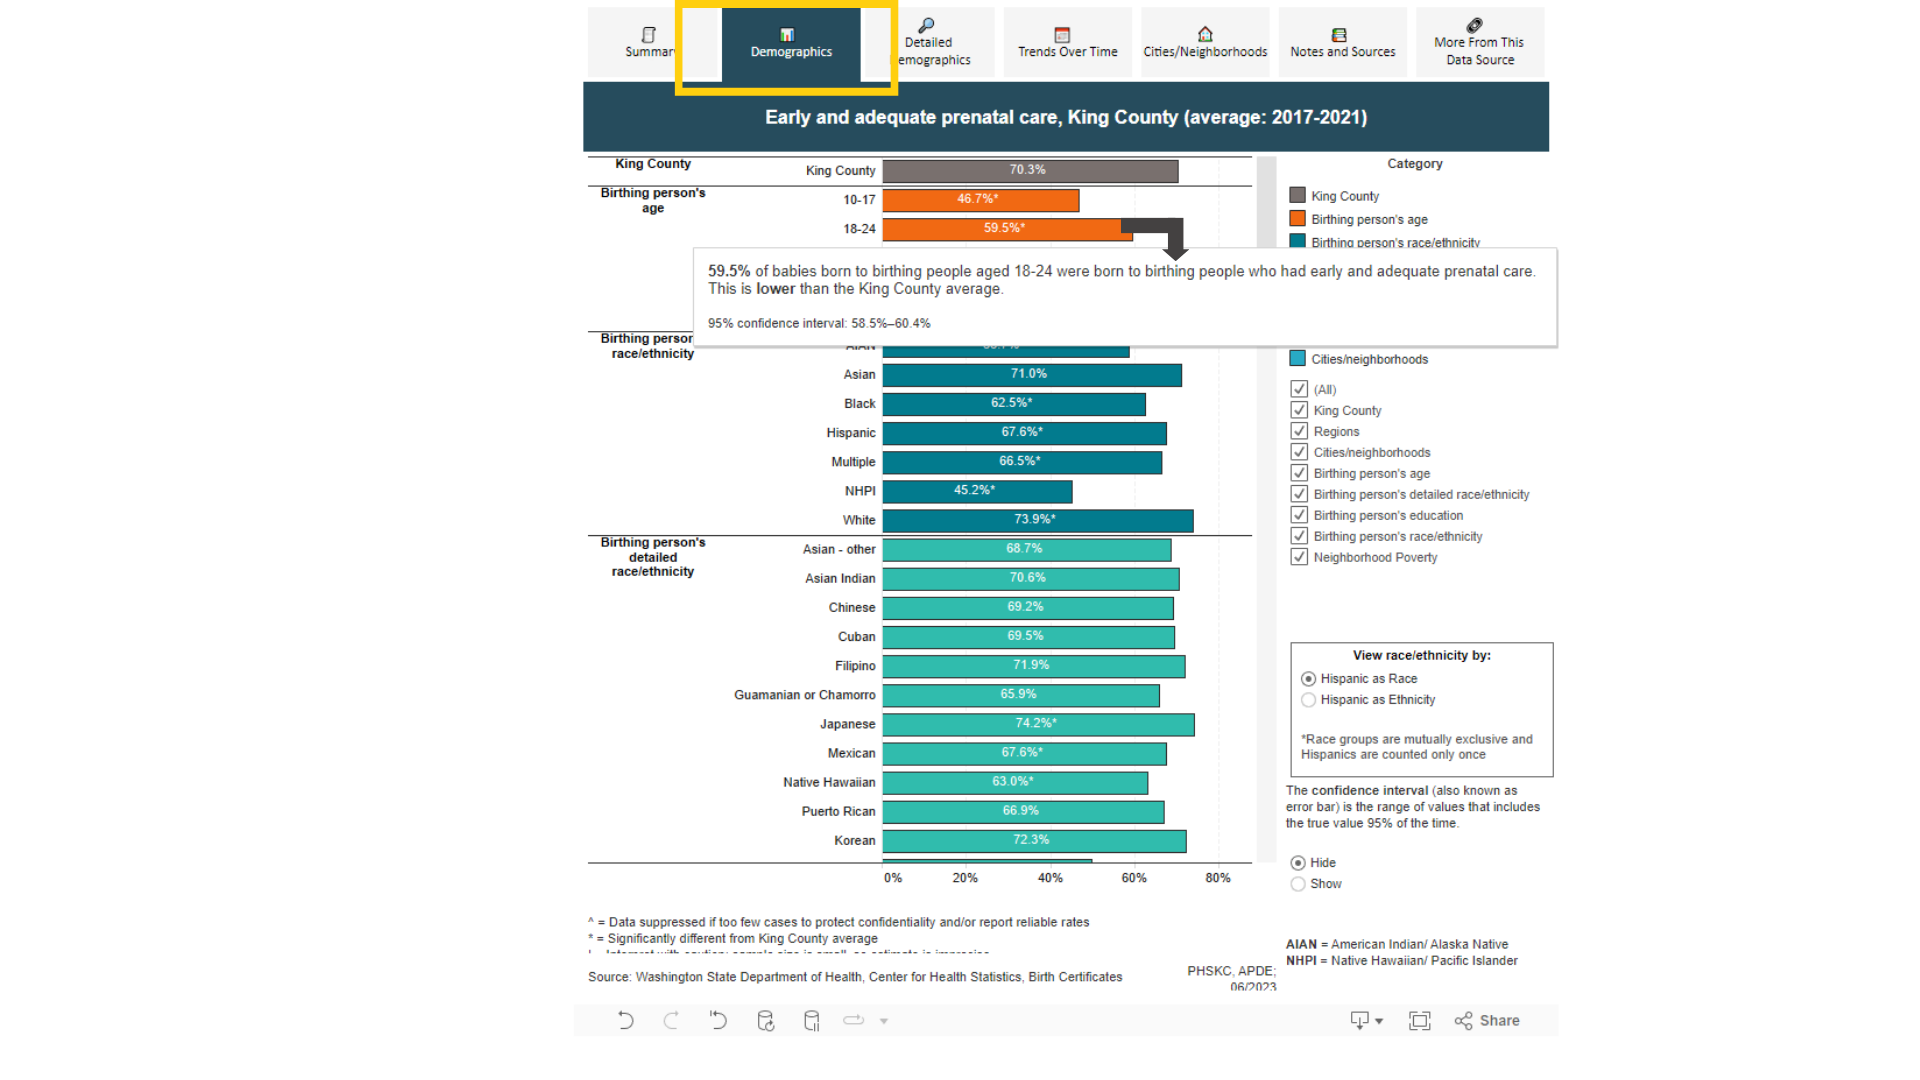
The demographics tab allows us to look for data specific by demographic groups. The charts also have an option to show or hide confidence intervals (also known as error bars). The confidence interval is the range of values that includes the true value 95% of the time. An asterisk sign (*) next to the number means that number is significantly different from the King County average. The next tab contains more detailed breakdowns of demographics, and the trends tab allows us to look at the data over time. This visualization also includes a tab on cities and neighborhoods, where indicator data can be viewed by geographic areas in a map or bar chart.
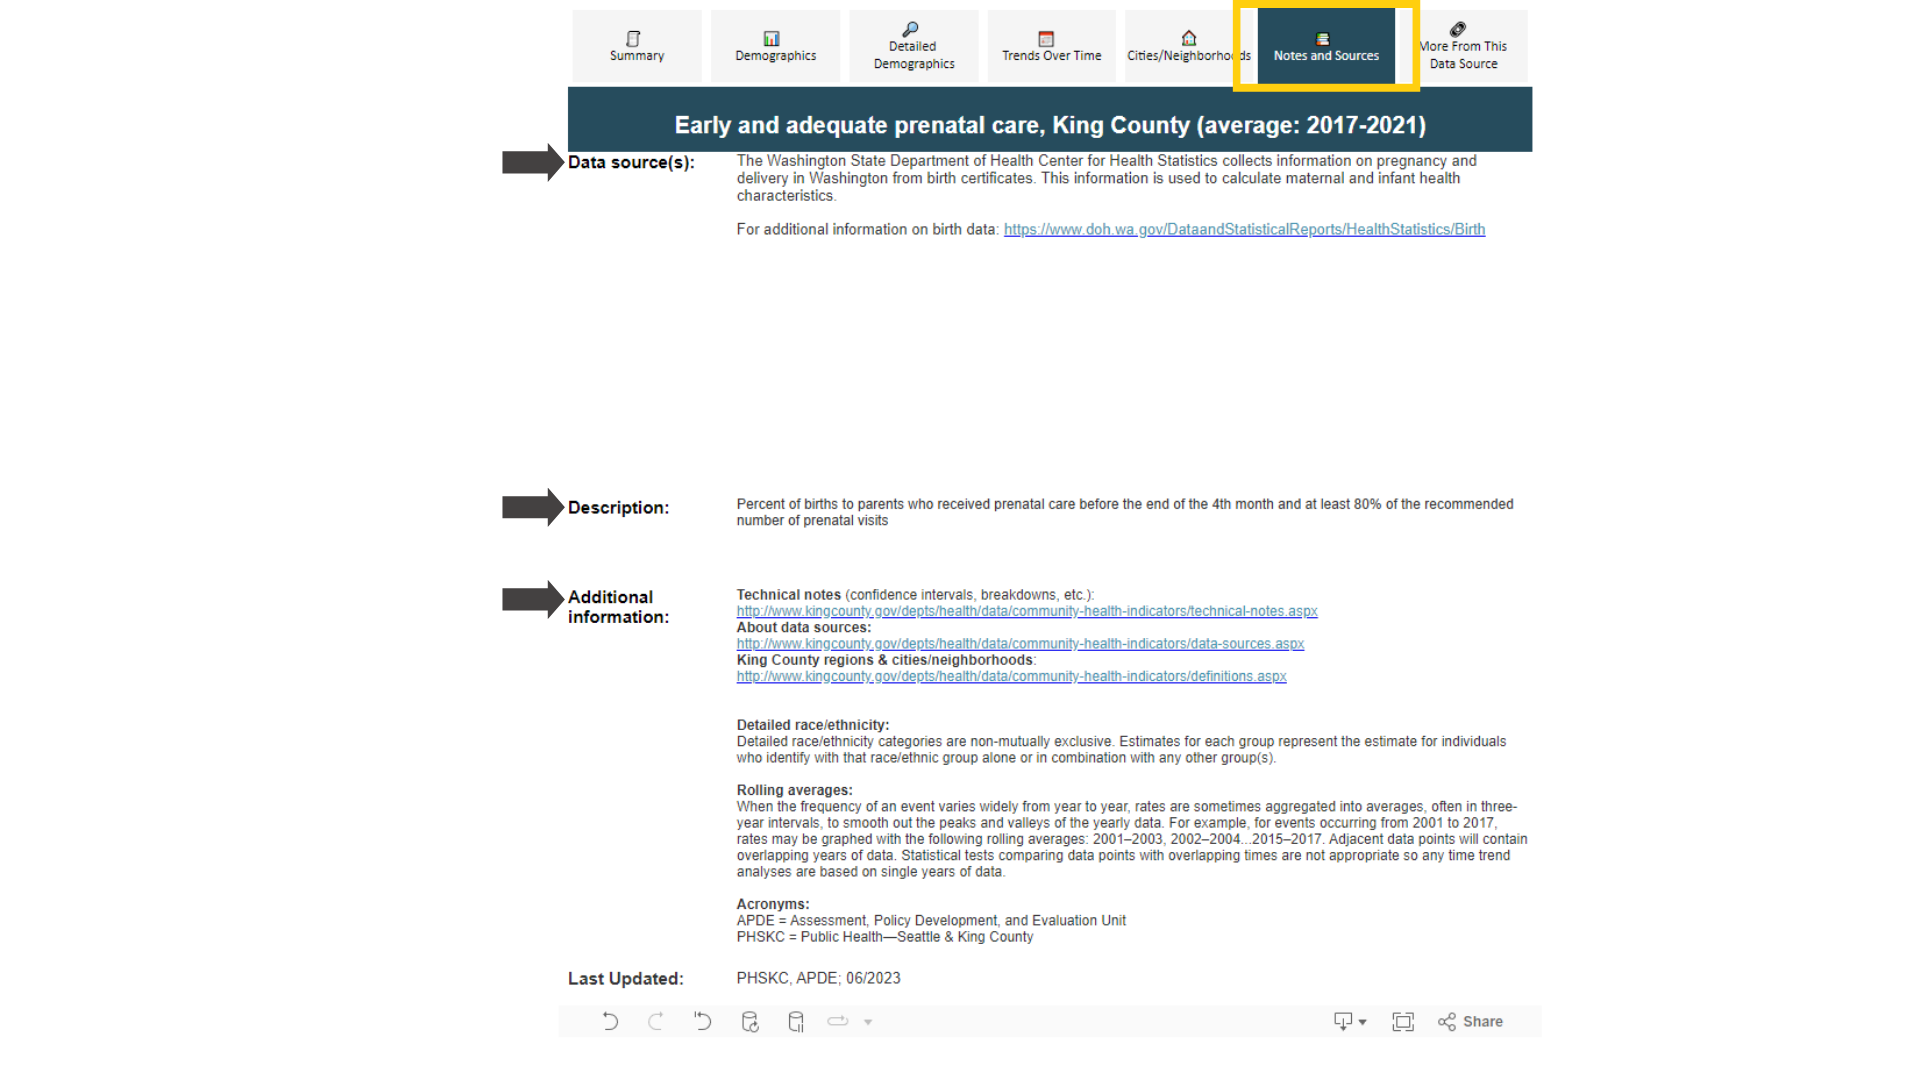
The next tab is the notes and sources tab which has information about data sources, description of the data, information about how the time trends and averages are calculated and additional information such as abbreviations.
The last tab is the "more from this data source" tab, which has a drop-down menu on the right where you can look at other indicators from the same data source. Select an indicator, and then click on any of the tabs or the arrow to see the indicator data.

To download data, in the bottom right corner of the visualization, click the button with the "Download" icon. A pop-up will open offering a variety of file formats. To download a spreadsheet of the underlying data, select "Crosstab". If you would like an image you can use, you can choose “Image” or “PDF.” You can also download a PowerPoint presentation with a slide for each tab of the workbook. If you selected "Crosstab", another pop-up will appear stating that the file has been generated. Select the “Download” button. If you selected data, a pop-up will appear with the first rows of data; select “Download all rows as a text file.”

Questions?
Visit our Frequently Asked Questions page for additional support.
If you have more questions, or if the indicator you are interested in does not allow for downloading data, you may contact us at communitiescount@kingcounty.gov.