Empowering Through Data: A Closer Look at Black Community Health
Introduction
In 2020, King County declared racism a public health crisis. And across many of the data resources we share on Communities Count, you can see the detrimental effects of racism on the health and wellbeing of Black King County residents. But there was no single place to find information about Black community health. When Communities Count was approached by colleagues who lead a Black Community Equity Team, we were excited to partner with them to create a resource based on their needs and interests.
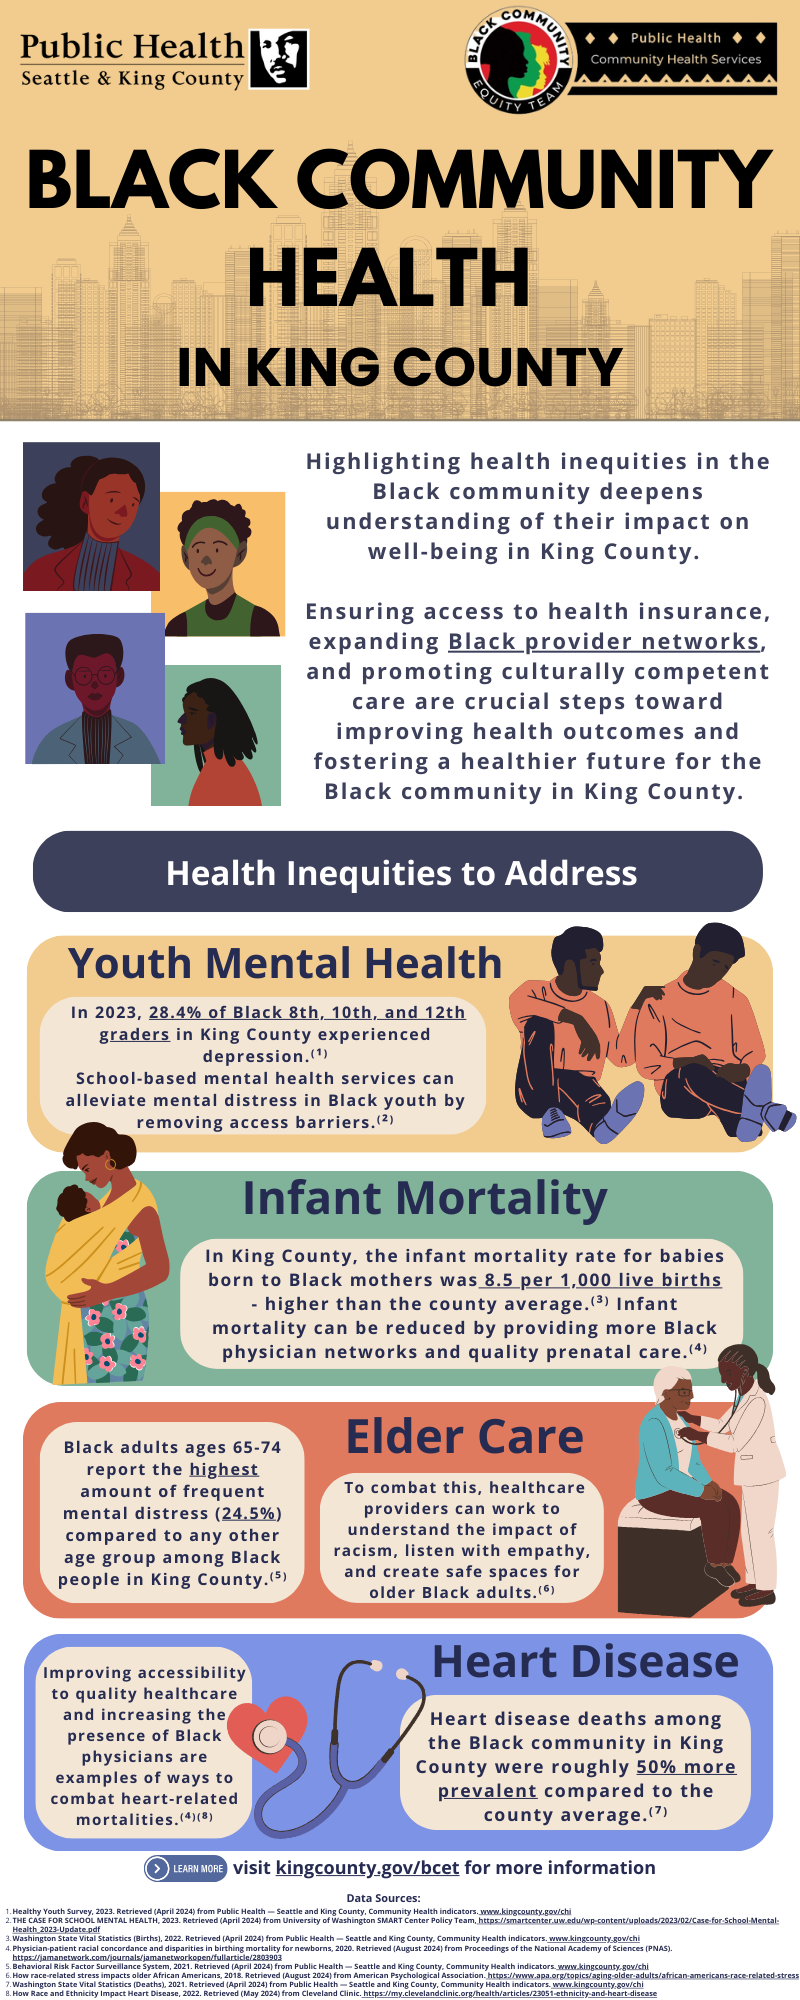
The result of this collaboration is an infographic designed specifically to highlight Black community heath, ensuring the health needs of King County’s Black community are addressed in an impactful and accessible way. We worked together with the Black Community Equity Team and Black Providers Network to create this visual aid to focus on Black community health with a goal of not only compelling content, but also making it accessible and engaging for community members and partners. You can view and download the infographic here.

A Tool for Understanding
The goal of this infographic was to create a tool that highlights Black community health inequities in King County that is accessible to community members and partners with varying experiences with data in a user-friendly format. By doing so, it equips communities with knowledge about systemic health inequities experienced by the Black community in King County.
Collaborative Efforts
In partnership with the Black Community Equity Team (BCET), the design process used intentional color choices in the graphics used as a way to reflect the rich diversity within the Black community. The project underwent multiple rounds of edits and feedback over several months between members of BCET, community partners and Communities Count, and in May 2024, was presented at BCET’s annual Black Providers Network Meeting for review and feedback from community partners to ensure every detail was reflective of the community’s needs while accurately representing the data.
Highlighted Key Findings
The infographic brings to light several critical findings about the health inequities experienced by the Black community in King County informed from data from Communities Count:
Mental Health: High prevalence of depression among Black youth.
Infant Mortality: High infant mortality rates for babies born to Black mothers.
Elder Care: Older Black adults ages 65-74 report higher mental distress compared to other age groups in the Black community in King County.
Heart Disease: Elevated prevalence of heart disease deaths among the Black community.
These findings reflect the alarming effects of systemic racism which underscore the urgent need for targeted interventions and policies to address these health inequities experienced by the Black community in King County.
Projected Impact & Next Steps
Moving forward, this infographic will serve as an educational resource in highlighting critical health inequities which aims to foster dialogue and actions towards improving access to culturally competent care.
However, it is more than just a static piece; it’s envisioned as a catalyst for change. By making complex data relatable and easy to digest, we aim to empower individuals and organizations alike to make informed decisions that could significantly improve health outcomes within King County communities thus transforming numbers into action for the promotion of a healthier future for King County’s Black community.
