Understanding Student Health & Well-Being: New King County Data Dashboard On Student Health Indicators
Introduction
As of the latest update in 2021, alcohol, cigarette, and cannabis use among students in grades 8, 10, and 12 across King County school districts are on a promising downward trend based on the recently released School District Health Profiles for King County.
The King County School District Health Profiles Dashboard is an interactive dashboard that brings attention to the overall health and well-being of students in our community. Building on previous static reports developed collaboratively with seven school districts in Seattle and south King County, this next iteration uses data from the 2021 Washington State Healthy Youth Survey (HYS) to paint a comprehensive picture of student health.
Each district’s Healthy Youth Survey Profile Report includes a summary of survey respondent demographics and 6 topic areas to explore through the dashboard:
Alcohol, tobacco, and drug use
Dietary behavior
Mental health
Obesity and overweight
Personal safety and violence
Physical activity
Purpose and Collaboration
The primary aim of this dashboard is to inform school policymakers, administrators, health and wellness planners, and the general public about critical student health behaviors and barriers to student success at the district level. The collaborative effort with initial participating districts—Auburn, Federal Way, Highline, Kent, Renton, Seattle, and Tukwila—forms the backbone of this updated report and we extend our deepest appreciation to these districts for their support of this interactive dashboard.
While the dashboard currently includes data from 7 districts, we hope to see additional districts participate with the release of the 2023 Healthy Youth Survey data later this year. This expansion aims to provide a more comprehensive understanding of student health trends across King County school districts.
Dashboard Walkthrough
Introduction Tab
From the ‘Introduction’ tab, explore a brief summary of the dashboard's purpose, the data it describes, and the topic areas covered. Users can navigate to different sections of the dashboard by clicking on a corresponding button.

Demographics Tab
The ‘Demographics’ tab features a detailed breakdown of survey respondents within each school district and King County overall (denoted by the black vertical lines on each bar). The interactive color-coded bar chart allows users to explore demographic characteristics of survey respondents including grade, language spoken at home, race/ethnicity, sex at birth and sexual orientation. Users can see additional details by hovering over bar charts with their cursor. Filter options on the right side of the bar chart allows for filtering by year, district, or display of confidence interval to enhance the user experience and engagement with the data presented.

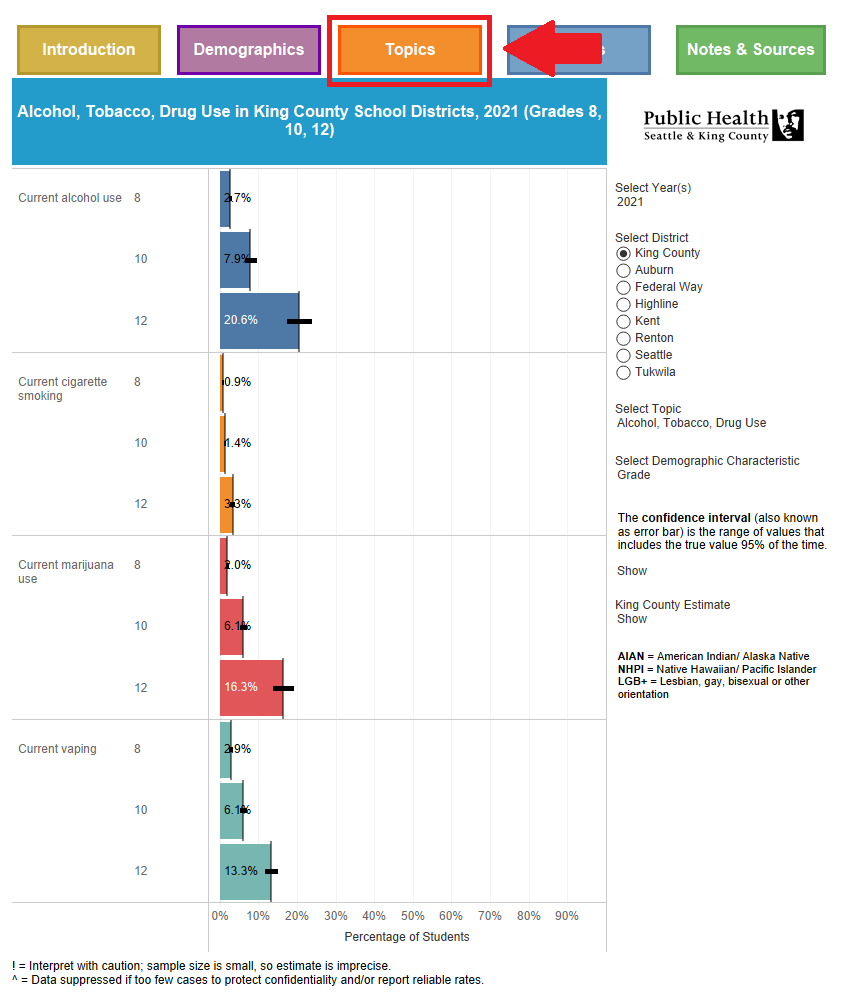
Topics Tab
The ‘Topics’ tab allows users to explore specific indicators within a topic by school district or King County overall, with interactive color-coded bar charts similar to the charts in the ‘Demographics’ tab. To begin exploring, select a topic of interest on the right. Once a topic of interest is selected, data can be filtered using the options on the right to display data by district, demographic characteristic, and with or without confidence intervals.
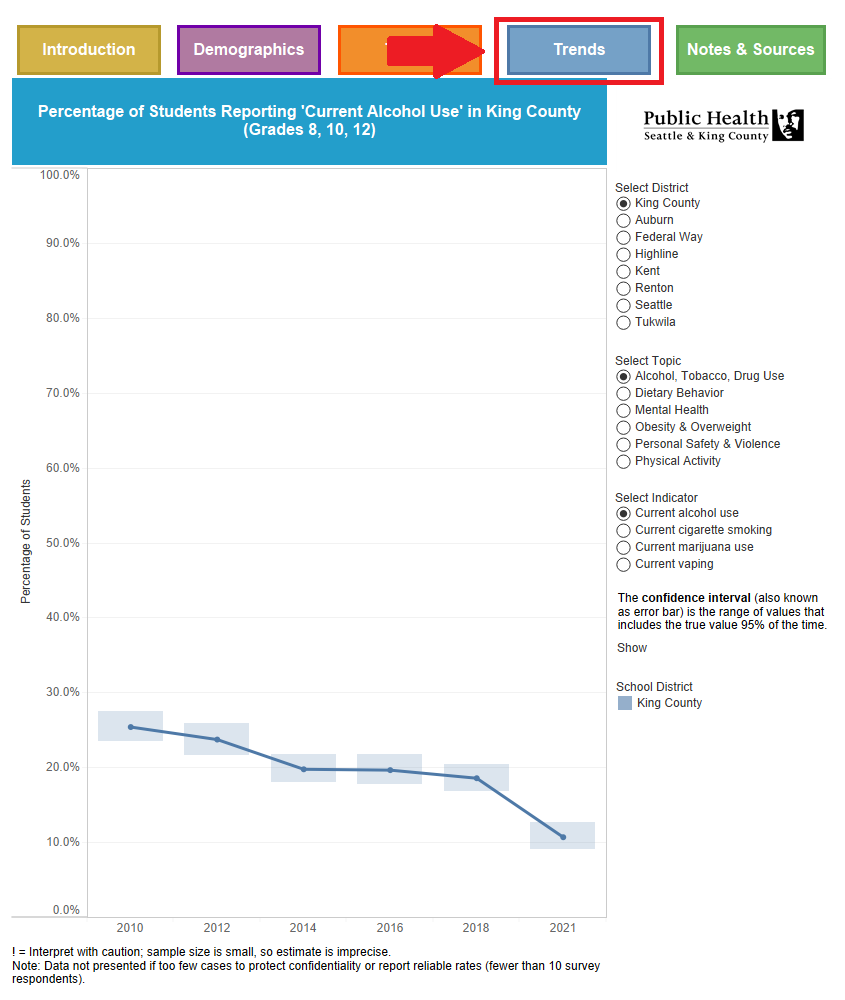
Trends Tab
The ‘Trends’ tab provides an interactive line graph about how an indicator changes over time within a district or the county overall. To display the line graph, select a district, topic, and a corresponding indicator from the options on the right side. Featured indicators are for a given topic and therefore will differ by topic. Hovering over each point in the line graph will display general information about the selected indicator based on the selected topic. Users have the option to display corresponding confidence intervals that are denoted by lightly shaded bars in the line charts.
Notes & Sources Tab
The ‘Notes & Sources’ tab provides additional information about the data summarized in this dashboard including technical notes about the data source and potential differences when compared with reports produced by Washington State Department of Health.

At Communities Count, we believe that access to this data can contribute to a deeper understanding of our students' health behaviors and well-being—empowering school districts and communities to make informed decisions and strategically allocate resources to address inequities and support student health.
For more information on the Healthy Youth Survey and other resources visit: